At Johnson & Johnson, we understand that human health and environmental health are fundamentally linked—healthy people need a healthy planet. For more than two decades, we have set and achieved carbon reduction goals. We have taken sustained, long-term action to reduce our greenhouse gas (GHG) emissions, and we are encouraging our suppliers to do the same.
As the largest, most diversified healthcare products company, we recognize our opportunity to drive positive change on issues that affect the health of the people we serve. We continually strive to improve the environmental footprint of our operations, our products and our value chain while also working with others to accelerate and scale solutions. And together with like-minded partners, we are working to tackle today’s global challenges at the intersection of human and environmental health, including climate change and health equity.
According to the WHO, climate change is the single biggest health threat facing humanity, and climate-sensitive health risks are disproportionately felt by the most vulnerable and disadvantaged.56
Paulette Frank
Chief Sustainability Officer,
Johnson & Johnson
Johnson & Johnson has set three public goals to reduce GHG emissions across our value chain. Our near-term goal to reduce Scope 1 + Scope 2 GHG emissions by 60% from 2016 levels, is validated by the Science Based Targets initiative (SBTi) as being consistent with the reductions required to keep global warming to 1.5°C.
Johnson & Johnson was recognized with a CDP A List rating in 2022 for our leadership in climate action for the fifth consecutive year, one of just 297 companies to be named to the Climate A List in 2022.
Since 2016, our absolute Scope 1 + Scope 2 GHG emissions have reduced by 41% (absolute reduction), from 1,166,456 MT CO2e in 2016 to 683,188 MT CO2e in 2022.
Scope 1 + 2 GHG Emissions (MT CO2e)*
Health for Humanity 2025 Goals
View Scorecard


Progress in Renewable Electricity
- 67% of electricity is produced or procured from renewable energy sources.
- In 2022, Johnson & Johnson signed additional renewable Power Purchase Agreements (PPAs) in Brazil and India. Previously signed renewable electricity agreements in Europe and the U.S. went into effect in 2022.
On track
Progress in Carbon Neutrality for Our Operations (by 2030)
- 41% (absolute reduction) in Scope 1 + 2 carbon emissions vs. 2016 baseline. 44% reduction including carbon credits.
- Five Johnson & Johnson sites were newly certified CarbonNeutral® by the external organization Climate Impact Partners, bringing the total number of our certified CarbonNeutral sites to six.
On track
Progress in Scope 3 Emissions Reductions (by 2030)
- 11% increase in greenhouse gas (GHG) emissions – Scope 3 (upstream) vs. 2016 baseline.
- Our Scope 3 emissions increased by 11% from 2016, driven primarily by Purchased Goods and Services and Upstream Transportation and Distribution. The calculation of emissions from both categories is based on spend data and category-specific economic input/output emission factors (versus activity-based emissions). Fuel price increases and inflation further exacerbated costs used in the calculation of emissions.
- Progress in 2022 includes becoming a founding member of the Pharmaceutical Industry’s program Activate, supporting active pharmaceutical ingredient suppliers in their decarbonization efforts. We also piloted a Joint Climate Action planning process with high emitting suppliers to identify areas of opportunity for collaboration to reduce Scope 3 emissions.
Some progress
Accelerating our use of renewable electricity
We are making meaningful progress in deploying renewable electricity across a greater portion of our operations around the world, with 67% of our global electricity use powered by renewables at the end of 2022.
Johnson & Johnson maintains more than 50 on-site renewable energy systems in 20 countries and has executed more than 15 contracts for off-site renewable electricity procurement.
Our global expansion of the use of renewable electricity and execution of virtual PPAs and green tariffs has been a significant factor in reducing our Scope 1 and Scope 2 emissions, in line with our goal to achieve carbon neutrality for our operations by 2030.
In 2022, we completed several initiatives to procure renewable electricity globally, propelling Johnson & Johnson toward our 100% renewable electricity goal at the global level by 2025. These initiatives included:
- Brazil: A direct PPA was signed for 100% renewable electricity from a wind farm in northern Brazil for all Johnson & Johnson operations in the country starting in 2023. This is the largest deal we’ve made in South America to date.
- India: A direct PPA was signed in Mulund, India, that will enable the Mulund Consumer Health plant to source some of its electricity from wind power in 2023.
- Australia, China and South America: Multiple Utility Green Tariffs were completed for renewable electricity across several sites.
- Mexico: A direct PPA from a wind farm in Mexico helps deliver part of Ethicon’s Juarez site with renewable electricity, as of September 2022.
- Malaysia, South Africa and Spain: Expansion of on-site solar power generation was completed at three Consumer Health sites.
Renewable Electricity Across Operations (as of the end of 2022)57
This data is the percentage of electricity used by Johnson & Johnson that is generated from renewable sources, including on-site and off-site renewable systems, like direct PPAs, virtual PPAs and Utility Green Tariffs. In Europe, three virtual PPAs that were finalized in 2021 brought us to the equivalent of 100% renewable electricity in Europe due to renewable electricity certificates (RECs) contracted for 2022.
North America
Europe
All Global Operations
57 Europe includes Belgium, France, Germany, Greece, Ireland, Italy, Netherlands, Poland, Spain, Sweden, Switzerland and the UK. North America includes the U.S. and Canada only.
On-Site Clean/Renewable Energy Capacity by Type (MW)*
In 2022, Johnson & Johnson Vision Care achieved 100% renewable electricity across its global manufacturing operations using Utility Green Tariffs and on-site solar in the U.S. and both on-site wind power and off-site wind power from a direct PPA in Ireland.
Minimizing GHG emissions through our operations and products
In addition to accelerating our use of renewable energy, we continue to invest in energy-efficient processes and equipment, green construction and lower-carbon renovations at our sites.
Since 2005, energy efficiency programs at our most energy-intensive manufacturing and R&D sites are allocated up to $40 million per year in capital relief through our CO2 Capital Relief Program, for energy projects that demonstrate potential CO2 savings and a financial return of at least 15%.
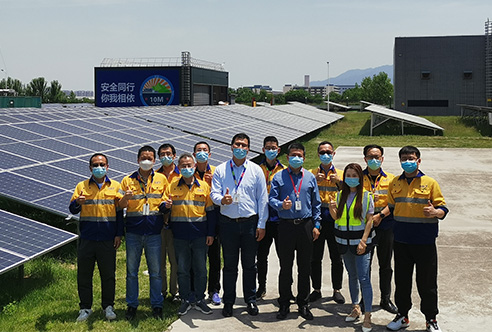
For example, Janssen’s Xi’an facility in China completed the second phase of photovoltaic (PV) panel installation as part of the CO2 Capital Relief Program, integrating it into its existing system.
CO2 Capital Relief Program Overview (2005–2022)58
annual energy cost savings
projects completed
annual energy savings
total spent on completed projects
annual GHG emissions avoided
58 Results from completed projects. Based on fuel and electricity reduction calculations. Avoidance of energy consumption and GHG emissions were calculated by comparing energy consumption before project implementation and expected consumption after implementation using engineering estimates at the time the projects are approved through an internal process.
In 2022, five Johnson & Johnson sites in France (Sézanne), Germany (Wuppertal), Italy (Pomezia), Switzerland (Neuchâtel) and the U.S. (Lititz, Pennsylvania) were newly certified CarbonNeutral® by the external organization Climate Impact Partners, bringing our total number of certified CarbonNeutral sites to six, including Helsingborg, Sweden, originally certified in 2017. Carbon emissions reductions were achieved through energy efficiency initiatives, such as HVAC optimization and chiller system replacements, waste-to-energy projects and renewable electricity use. Carbon credits and carbon offsets were utilized for remaining emissions.
Reducing energy consumption
Overall, between 2016 (our base year for the Health for Humanity 2025 Environmental Goals) and 2022, we reduced our total energy consumption by 8%, while our business grew by 32% in the same period. In other words, our energy intensity, expressed as TJ per $ billion in sales to customers, reduced by 30%, strongly demonstrating the cumulative effect of continuous improvement and deliberate energy efficiency initiatives, year after year, across our global operations.
Since 2016, our total absolute energy consumption across all Johnson & Johnson sites has reduced by 8%, from 12,811 TJ in 2016 to 11,800 TJ in 2022. This represents 30% energy reduction on an intensity basis, per $ billion in sales.
Total Energy Use Since 2016 (TJ)*
Energy Intensity Since 2016 (TJ/$ Billion)*
Green buildings
We continue to pursue Leadership in Energy & Environmental Design (LEED) certification or equivalents (such as Building Research Establishment Environmental Assessment Methodology [BREEAM]). In 2022, we added one LEED certification across our facilities, bringing our total at the end of 2022 to 68 LEED-certified and BREEAM-certified Johnson & Johnson sites.
Green labs
In 2022, our J&J MedTech DePuy Synthes R&D lab in Leeds, UK, and our Janssen Immunology lab in California, both achieved “My Green Lab®” certification for implementing sustainability best practices. My Green Lab certification is recognized by the UN Race to Zero campaign as a key measure of progress toward a zero-carbon future and is considered the gold standard for laboratory sustainability best practices around the world. We intend to seek certification for more Johnson & Johnson labs in the coming year.
Driving carbon reductions across our value chain
Engaging with our key suppliers across our global supply base is critical to reducing our absolute upstream Scope 3 GHG emissions in line with our Health for Humanity 2025 Goal of 20% reduction by 2030 (from 2016 levels).
Upstream Scope 3 GHG Emissions (MT CO2e) by Source*
To make progress in this area, our procurement and logistics teams worked closely to identify and realize opportunities to improve our Scope 3 data and drive emissions reductions. We introduced a new Upstream Scope 3 strategy that encompasses:
- Improving data quality: We are piloting a collection of more detailed sources of emissions data for our supply base, as well as using our data science capabilities to visualize CDP Supply Chain data that shows the maturity level of our largest-emitting suppliers, including their goals, emissions footprint and reductions.
- Building capability: We are helping to educate suppliers on emissions measurement and disclosure, as well as renewable energy adoption. We have also trained our procurement teams to support high-quality data submission by suppliers to CDP.
- Driving reductions: We are piloting a Joint Climate Action Planning process with high-emitting suppliers across various industries to help us understand their climate goals and efforts needed to achieve them. Through Joint Climate Action Planning, we are able to identify the biggest opportunities to collaborate with suppliers to drive reductions in our Scope 3 emissions.
Regarding logistics, we continued to work with suppliers to reduce shipping-related emissions. For example, in Europe, Johnson & Johnson introduced a “rolling highway” project that transports fully loaded trucks by rail between Italy and Belgium, significantly reducing emissions from road travel. This program will be expanded to include more shipments in 2023.
Partnering for climate action
In 2022, we also engaged with two initiatives to support collective efforts in driving down GHG emissions in pharmaceutical supply chains. These were:
- The Energize Program: A pharmaceutical industry collaboration platform with an aim to increase access to renewable electricity within pharmaceutical supply chains and to educate suppliers about renewable energy adoption and contracting. More than 160 Johnson & Johnson suppliers have registered to the platform. In 2022, the Energize program supported its first renewable electricity buyers cohort—a group of companies that came together to contract for renewable electricity at scale via a PPA.
- The Activate Program: A pharmaceutical industry collaboration, launched in 2022, bringing together five pharmaceutical companies, including Johnson & Johnson, as founding members to support active API suppliers in their decarbonization efforts through measurement of their GHG emissions and provision of practical decarbonization tools.
We continued to engage in partnerships and coalitions to help make a positive impact on the health of our climate beyond our value chain:
- In early 2022, the National Academy of Medicine’s (NAM’s) Action Collaborative on Decarbonizing the U.S. Health Sector, a public-private partnership of leaders from across the health system, began engagement after forming in 2021. The Climate Collaborative is a forum to align around collective goals and actions for decarbonization, based on evidence, shared solutions and a commitment to improve health equity. One of the current work streams of this group focuses on developing and sharing resources to help healthcare supply chain companies start or accelerate their sustainability journeys.
- In 2022, we were foundational funders of the Beyond the Megawatt Initiative from the Clean Energy Buyers Institute (CEBA), charged with creating a resilient, equitable and environmentally sustainable energy system for the benefit of all by leveraging energy customer demands for clean energy.
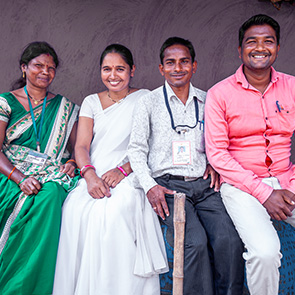
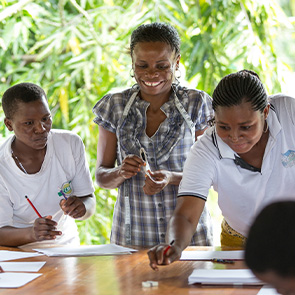
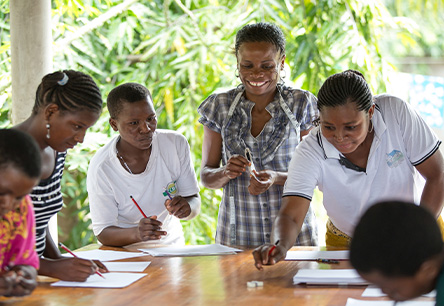
We also work with partners to advance environmental health equity. This includes supporting programs to empower healthcare workers and to strengthen the resilience of healthcare facilities in areas where it’s needed most.
56 WHO, “Climate change and health,” https://www.who.int/news-room/fact-sheets/detail/climate-change-and-health, accessed February 2023.